Example 4: GA Effect
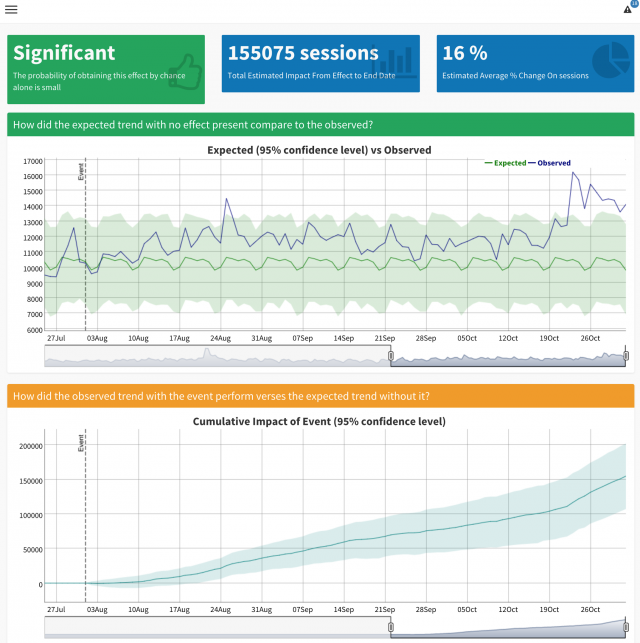
This is a Shiny app made to test if an event has a statistically significant effect.
It connects to your Google Analytics data via an ancestor of googleAnalyticsR, displays it in a Shiny application styled with shnydashboard, applies Bayesian statistics using CausalImpact and then displays the results in an interactive HTMLwidget for time-series called dygraphs.
Try out the Shiny App here.
A full introduction blog post is available on the Online Behavior blog, and you can dive more into the technical details via the How I made GA Effect blog post.